Tutorial Electrophysiology
Heart disease is among the leading causes of death in the Western world; hence, a deeper understanding of cardiac functioning will provide important insights for engineers and clinicians in treating cardiac pathologies. However, the heart also offers a significant set of unique challenges due to its extraordinary complexity. In this respect, some recent efforts have been made to be able to model the multiphysics of the heart using LS-DYNA.
The model starts with electrophysiology (EP) which simulates the propagation of the cell transmembrane potential in the heart. This electrical potential triggers the onset of cardiac muscle contraction, which then results in the pumping of the blood to the various organs in the body. The EP/mechanical model can be coupled with a Fluid and Structure Interaction (FSI) model to not only study the clinically relevant blood flow parameters as well as valves or cardiac devices.
Different propagation models, called “mono-domain” or “bi-domain”, which couple the diffusion of the potential along the walls of the heart with ionic equations describing the exchanges between the inner and the outer parts of the cells have been implemented. These models were first benchmarked against published results obtained from other EP research codes on a simple cuboid heart tissue model. Other simulations were then performed on more realistic geometries. Since the potential diffusion is highly orthotropic, with much larger diffusion coefficients along the fibers of the tissue than transversely, it is important to correctly model these fibers, which creates models with very large numbers of elements (several tens to hundreds of millions of elements). We thus implemented capabilities to be able to handle such large-scale models. In this section, some EP models will be presented along with some results.
*EM_BOUNDARY_PRESCRIBED
*EM_CONTROL
*EM_CONTROL_TIMESTEP
*EM_EP_CELLMODEL_DEFINEFUNCTION
*EM_EP_TENTUSSCHER
*EM_EP_TENTUSSCHER_STIMULUS
*EM_MAT_003
*EM_MAT_005
*EM_OUTPUT
*EM_SOLVER_FEM
*END
Figure 1 : EP_Niederer_monodomain :
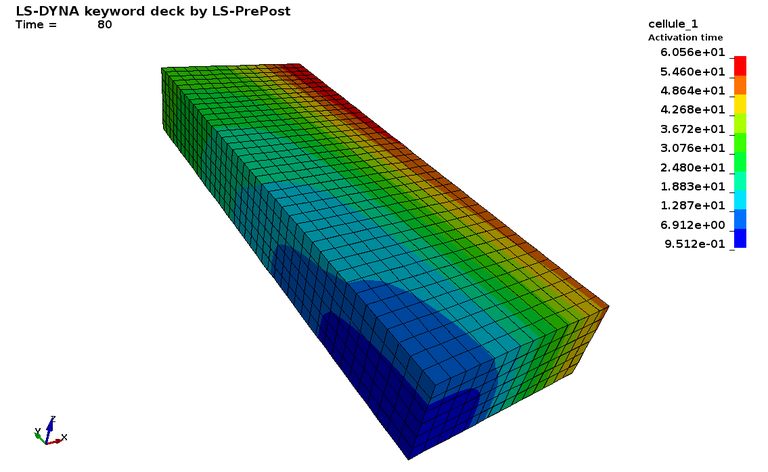
Figure 2 : EP_FDA_M3D :
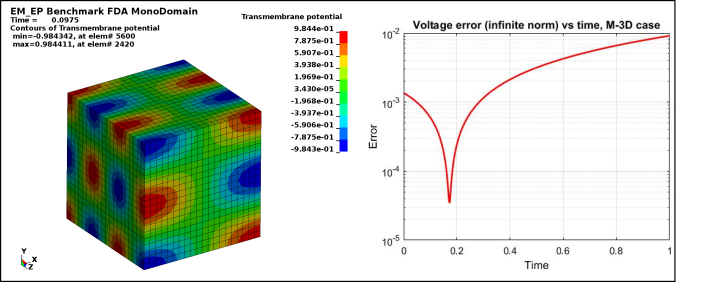
Figure 3 : EP_FDA_B3D :
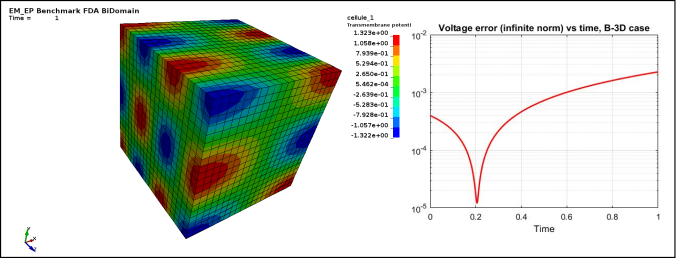
Figure 4 : EP_FDA_BB3D :
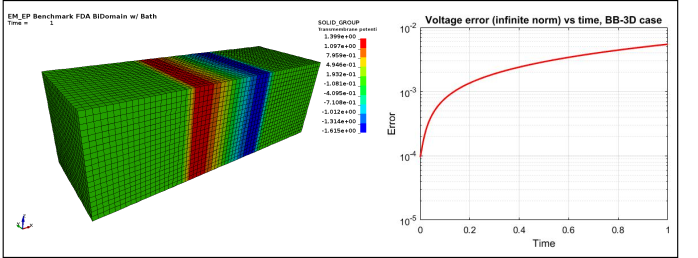
Figure 5 : EP_bath_BDM :
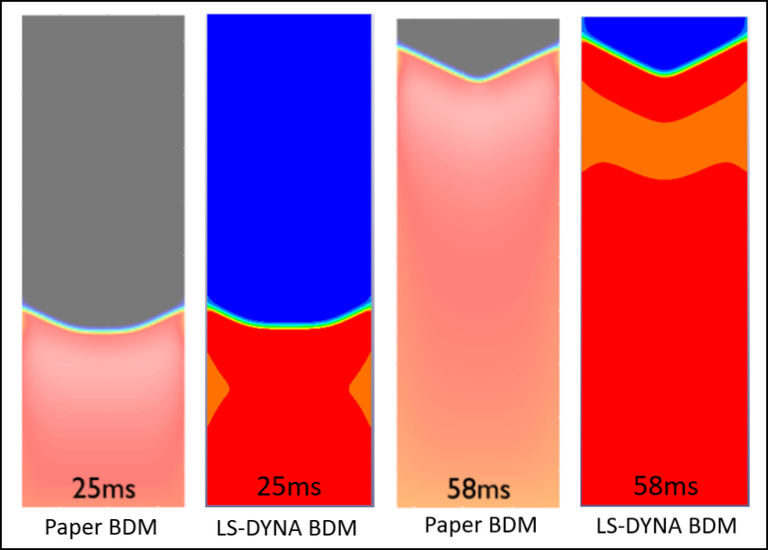
Figure 6 : EP_bath_MDMEQ
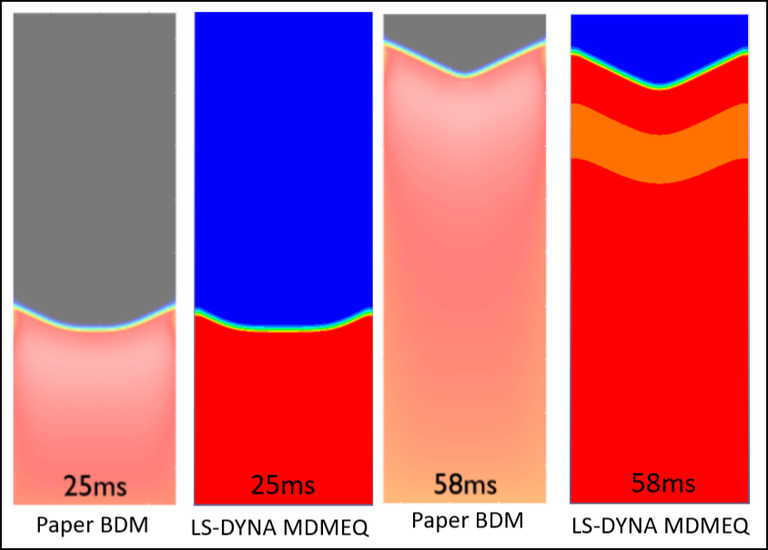
Figure 7 : EP_ventricle_arrythmia
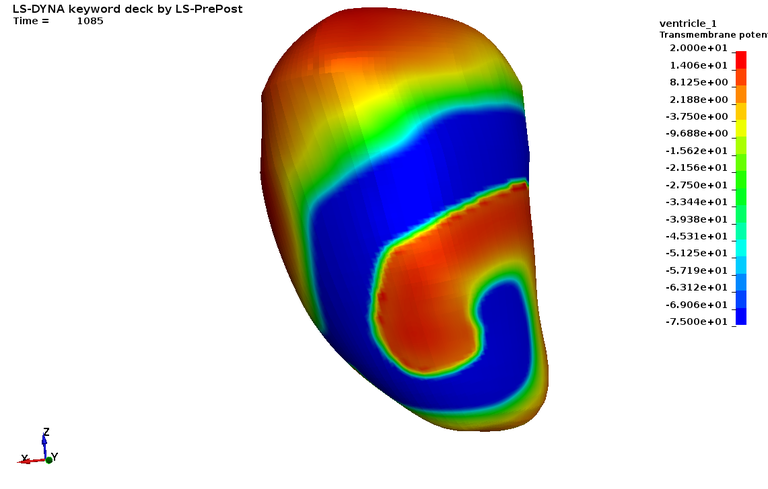
Figure 8 : EP_realisticbiventricularheart_fibergeneration

Figure 9 : EP_realisticbiventricularheart_purkinjegeneration
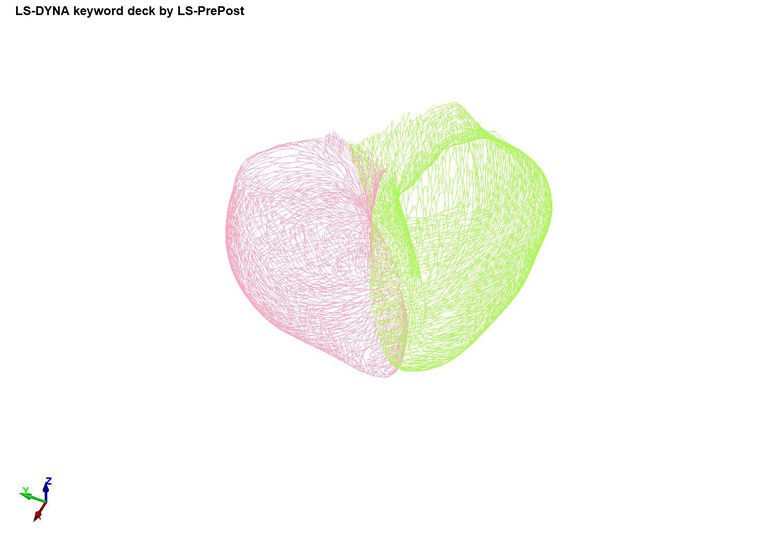
Figure 10 : EP_realisticbiventricularheart_simulation
This first case corresponds to the Model M-3D (3D monodomain model) with meshsize dx = 0.5, timestep dt = 0.01 of the paper "Niederer SA, Kerfoot E, Benson AP, et al. Verification of cardiac tissue electrophysiology simulators using an N-version benchmark". Philos Trans A Math Phys Eng Sci. 2011;369(1954):4331–4351.
The paper provided the benchmark evaluated by 11 simulation platforms to generate a consensus converged solution.
Case 1 - EP_Niederer_monodomain.zip : See Figure 1 for activation time.
The next three cases respectfully correspond to the Model M-3D (3D monodomain model), Model B-3D (3D bidomain model) and Model BB-3D (3D bidomain with bath model) with h=0.05 of the paper "Pathmanathan, P. and Gray, R. A. (2014), Verification of computational models of cardiac electro‐physiology". Int. J. Numer. Meth. Biomed. Engng., 30: 525-544.
Those are some of the electro-physiology benchmarks proposed by the FDA, with an analytical solution to compare with.
Case 2 -EP_FDA_M3D.zip : See Figure 2 for Transmembrane potential and voltage infinite norm error vs time.
Case 3 -EP_FDA_B3D.zip : See Figure 3 for Transmembrane potential and voltage infinite norm error vs time.
Case 4 -EP_FDA_BB3D.zip : See Figure 4 for Transmembrane potential and voltage infinite norm error vs time.
This next two cases respectfully corresponds to the Model BDM (full bodomain) and Model MDMEQ (augmented monodomain equivalent bidomain model) of the paper "Representing cardiac bidomain bath-loading effects by an augmented monodomain approach: application to complex ventricular models", M. Bishop and G. Plank, IEEE Trans Biomed Eng. 2011; 58(4) 1066-1075.
Case 5 -EP_bath_BDM.zip : Figure 5 shows the comparison of voltage distributions within the slab model following a pacing simulus along the x=0 face between the BDM solution in the paper and BDM solution by LS-DYNA.
Case 6 -EP_bath_MDMEQ.zip : Figure 6 shows shows the comparison of voltage distributions within the slab model following a pacing simulus along the x=0 face between the BDM solution in the paper and BDM solution by LS-DYNA.
The following case corresponds to an arrhythmia with spiral waves in a simple ventricle-like geometry, using the mono-domain. The spiral waves are created by the second stimulus in the refractory tail of the wave created by the first stimulus. If the second stimulus is commented out, the case corresponds to a healthy ventricle.
Case 7 -EP_ventricle_arrhythmia.zip :Figure 7 shows the transmembrane potential with the spiral wave formation.
The following three cases are based upon a realistic biventricular heart model from a publically available database of heart meshes published in: Strocchi, M., Augustin, C. M., Gsell, M. A., Karabelas, E., Neic, A., Gillette, K., ... & Niederer, S. A. (2020). A publicly available virtual cohort of four-chamber heart meshes for cardiac electro-mechanics simulations. PloS one, 15(6), e0235145.
The first case shows an example of fiber orientation generation based on the rule-based method from: Bayer, J. D., Blake, R. C., Plank, G., & Trayanova, N. A. (2012). A novel rule-based algorithm for assigning myocardial fiber orientation to computational heart models. Annals of biomedical engineering, 40(10), 2243-2254. This case outputs a file called element_solid_ortho.k which contains fiber information. The output of the simulation is a file called element_solid_ortho.k, which contains the vectors "a" and "d" for each element (see AOPT=2 in *MAT_002).
The second case shows how to generate Purkinje tree in the left (using input file mainLEFT.k) and the right (using input file mainRIGHT.k) endocardium. The simulation generates a file called purkinjenetwork.k which contains the new generated nodes and beams that form the Purkinje network.
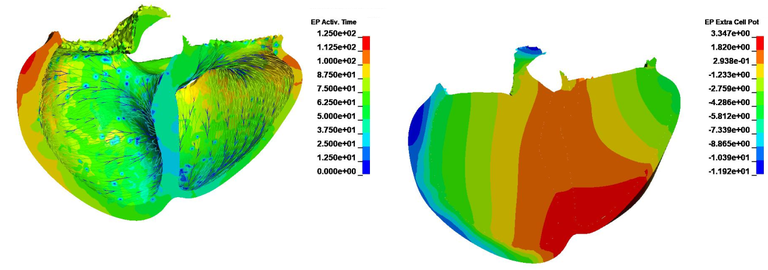
The third case uses the previously generated fibers and purkinje networks and includes blood pools inside the left and right ventricles in a monodomain simulation (see figure 10a and 10b).
Case 8 -EP_realisticbiventricularheart_fibergeneration.zip : Figure 8 shows the fiber generation.
Case 9 -EP_realisticbiventricularheart_purkinjegeneration.zip : Figure 9 shows the Purkinje networks.
Case 10 -EP_realisticbiventricularheart_simulation.zip : Figure 10 shows the EP Activation time and Extra Cellular Potential.
